Statistical Analysis of Genetic Association Studies
We are developing methods for analysis of genetic association studies, using imputation and Bayesian variable-selection regression. We distribute software, BIMBAM, implementing these methods.
 The aim of imputation-based approaches to association mapping is to
allow genetics variants that were
not actually typed in an association study to be tested for
association. This is possible only because such untyped
variants are often correlated, in a known way, with one or more typed
variants. Testing imputed variants
can increase power to detect associations, particularly when it is
used to combine data from multiple studies that use different
genotyping platforms: imputation greatly
facilitates such meta-analyses, since it overcomes the hurdle that the
different studies typed different variants,
by allowing the same set of variants to be tested in all studies.
The aim of imputation-based approaches to association mapping is to
allow genetics variants that were
not actually typed in an association study to be tested for
association. This is possible only because such untyped
variants are often correlated, in a known way, with one or more typed
variants. Testing imputed variants
can increase power to detect associations, particularly when it is
used to combine data from multiple studies that use different
genotyping platforms: imputation greatly
facilitates such meta-analyses, since it overcomes the hurdle that the
different studies typed different variants,
by allowing the same set of variants to be tested in all studies.
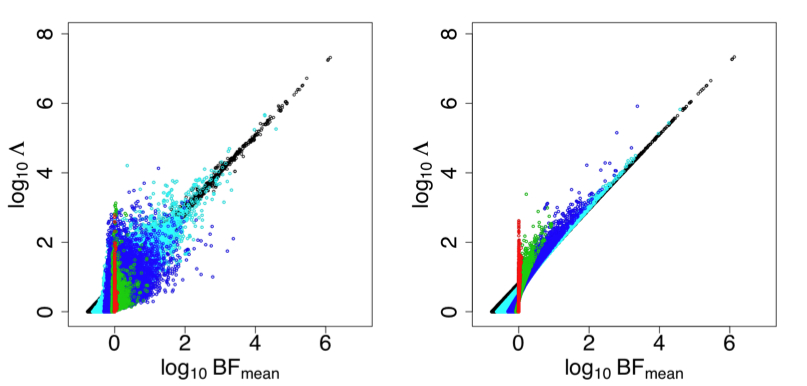
The basic idea behind imputation is to learn about patterns of correlation from a reference panel of densely-genotyped individuals (e.g., the HapMap), and then to use this knowledge to build a way of predicting ("imputing") unmeasured genotypes that are correlated with measured genotypes. We have developed two different approaches to performing this prediction, both based on Hidden Markov Models (Li and Stephens, Scheet and Stephens). We have also worked on methods for testing these imputed variants, taking account of the uncertainty in the predicted genotypes (Servin and Stephens, Guan and Stephens). Somewhat surprisingly, it turns out that satisfactory results can often be obtained by simply replacing imputed genotypes with a point estimate - the posterior mean - and then performing a simple regression-based analysis of phenotype on the resulting imputed genotypes. This is helpful as it considerably reduces the computational cost of testing the millions of imputed variants. See Guan and Stephens for a demonstration that this approach produces similar results to a more principled approach that averages over the full distribution of imputed genotypes.
In addition to imputation, we are actively developing Bayesian methods for the analysis of association studies, based on sparse variable-selection Bayesian regression. Here our aim is to analyse many genetics variants (perhaps millions) simultaneously, and search for combinations of variants that are associated with the response. This kind of variable selection problem arises frequently in statistics, and many tools exist for tackling it, including sparse regression methods (e.g., LASSO) and Bayesian regression. We believe the Bayesian approach has an advantage in this setting for several reasons, including particularly that it provides not just a single "best" combination of variants, but a measure of how certain we are that each variant is relevant: something that in the context of genetic association studies is particularly important as we are truly interested in the relevant variables (hoping that their identification will yield helpful biological insights), and not only in predicting outcomes. We hope to release software soon implementing methods that can deal with realistic-sized data sets (thousands of individuals typed at hundreds of thousands of markers) with moderate computational resources.
RNA-seq and gene expression analysis
 Variation in gene expression is an important potential underlying
cause of other types of variability, including potentially
medically-relevant variation. My lab has several ongoing projects
related to understanding gene expression variation among individuals,
and between species. These projects are joint with the labs of
Jonathan Pritchard
and Yoav Gilad.
Variation in gene expression is an important potential underlying
cause of other types of variability, including potentially
medically-relevant variation. My lab has several ongoing projects
related to understanding gene expression variation among individuals,
and between species. These projects are joint with the labs of
Jonathan Pritchard
and Yoav Gilad.
One particularly interesting recent development is the use of
high-throughput sequencing to measure gene expression. This new
technology provides the potential to yield more detailed view of the
transcriptome than do micro-arrays that have formed the basis of most
gene expression experiments in the last 15 years or so. In a pilot
project joint with the Gilad lab
(Marioni et al.) we assessed
the technical reproducibility of this RNA-seq technology, and compared
it with results from Affymetrix arrays. We found that the results
from RNA-seq were generally highly technically reproducible (at least
provided that different samples were sequenced at the same
concentration) and generally concordant with those from the array. We
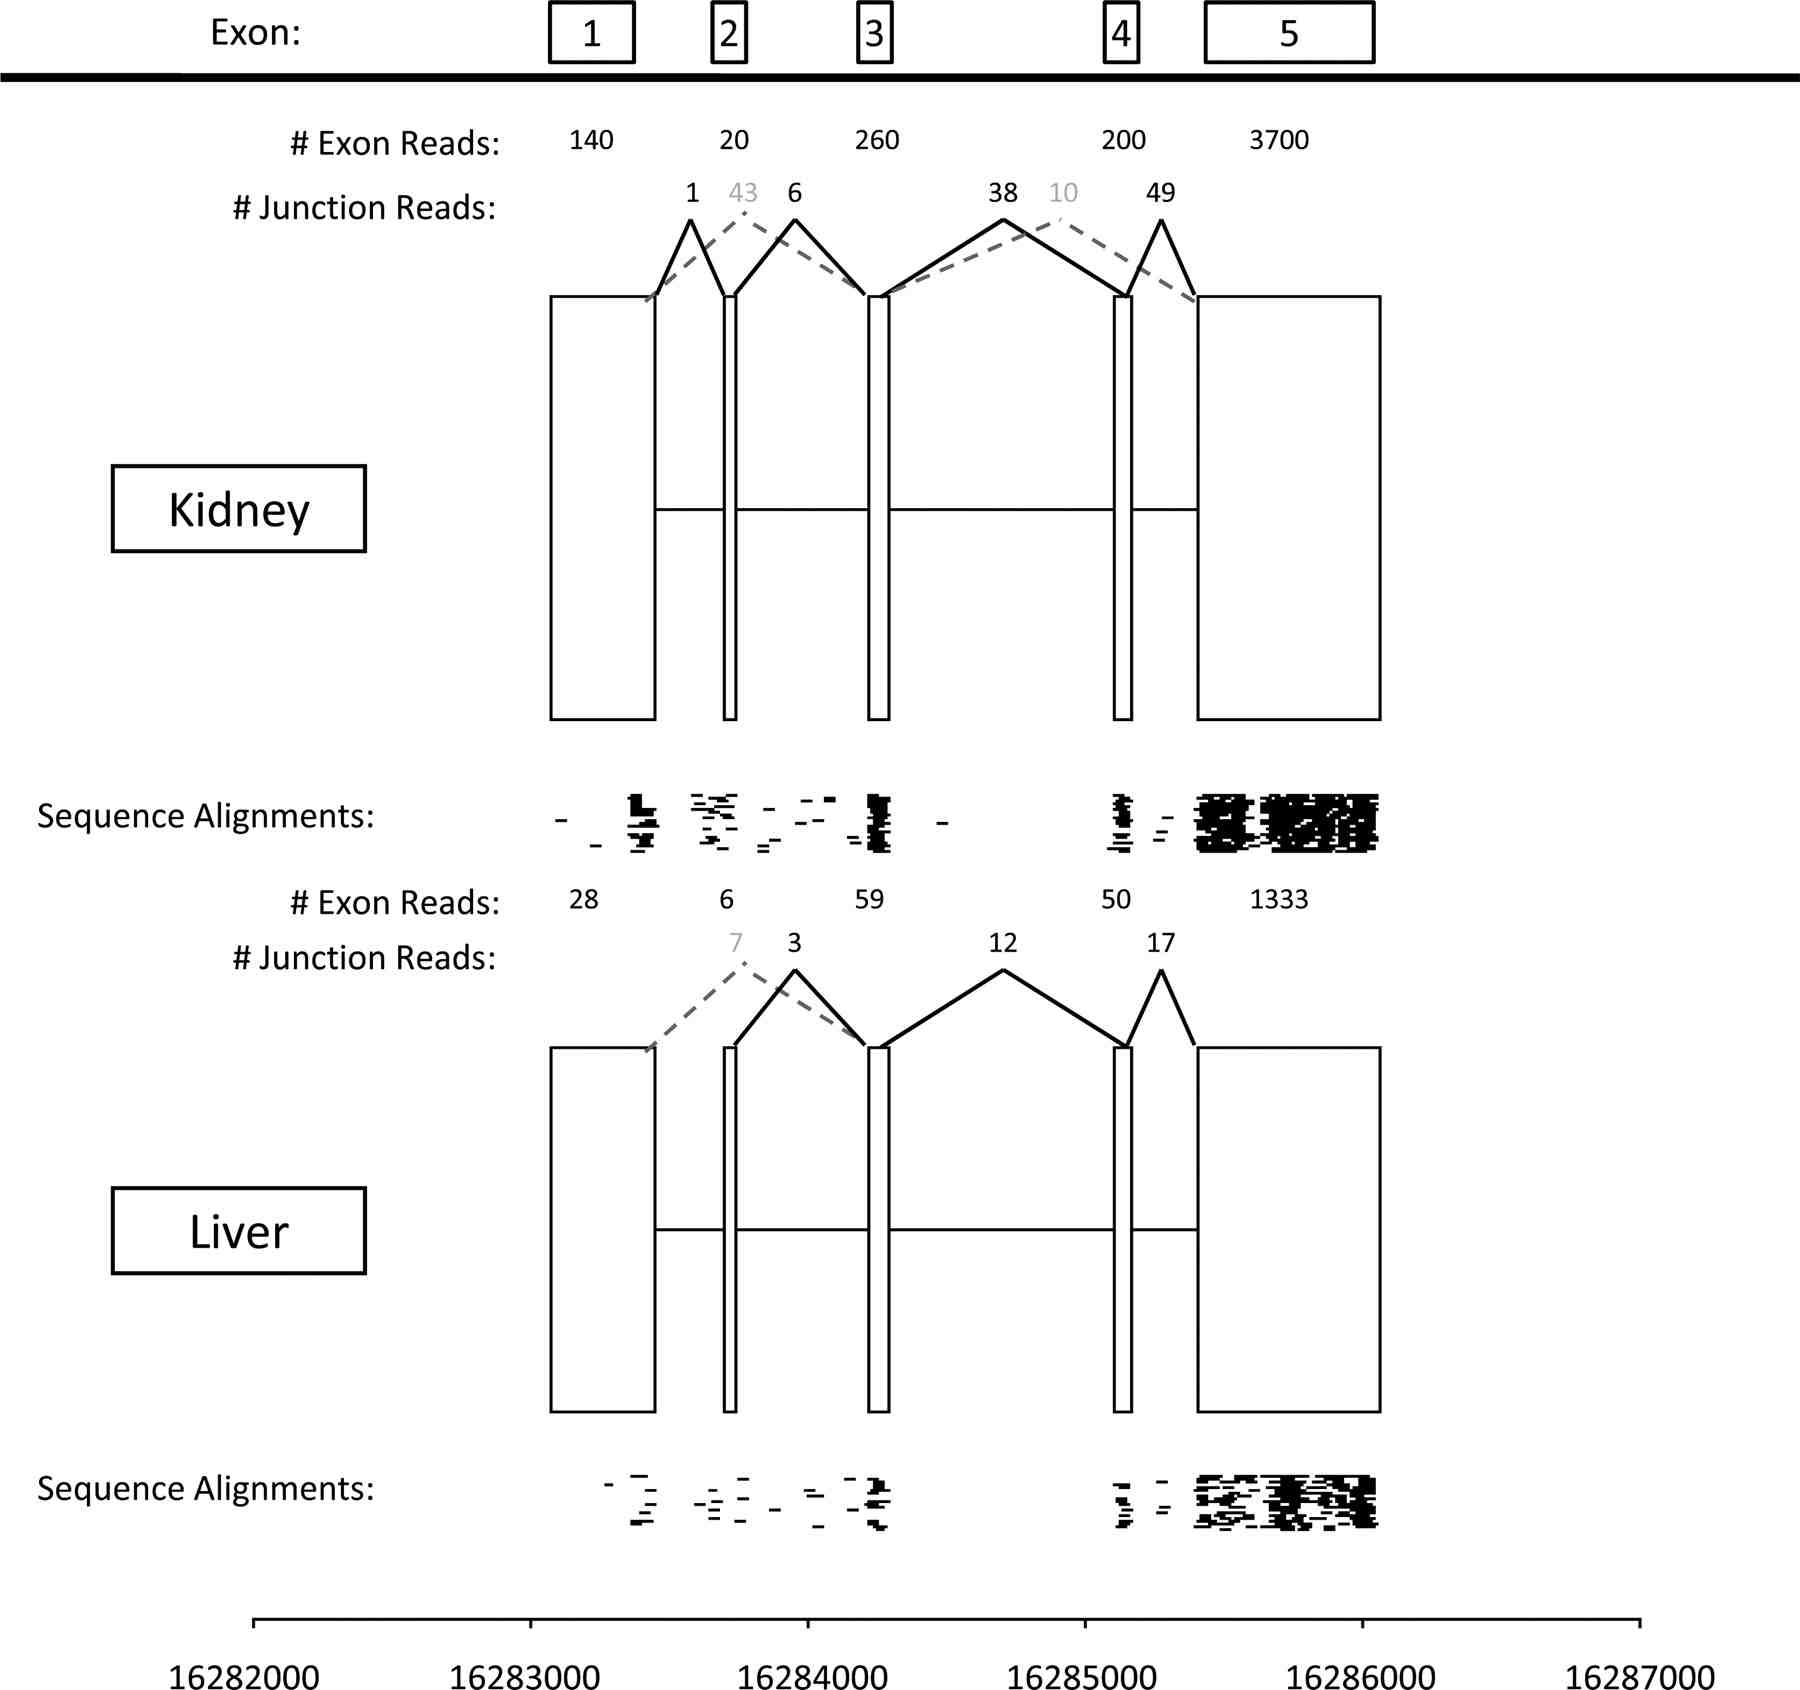
are currently engaged in projects that aim to exploit the detailed
information that RNA-seq can yield about the expression levels of
individual exons within each transcript, to identify differences in
exon usage (e.g., alternative splicing) among individuals and species.
Population Structure and Conservation Genetics
I have a long-standing interest in statistical methods for
understanding population structure. Our first work in this area was
joint
with Jonathan
Pritchard, and resulted in the development of the
structure
software for analysis of population structure. In brief,
structure is a model-based clustering method, which clusters
individuals into groups on the basis of the genetic data, but allowing
for the fact that some individuals may have ancestors from more than
one group ("admixed"). The type of model we used is sometimes referred
to as a "Grade of Membership" model in other fields, and has close
connections with the "latent dirichlet allocation" (LDA) model
introduced at about the same time in document clustering
applications. More recently we have been working on methods for
understanding "continuous" population structure, where individuals
genetic make-up varies more continuously (e.g., geographically) and
may not be well-described by the more discrete model under-lying
structure. One tool we have found useful is Principal Component
Analysis. 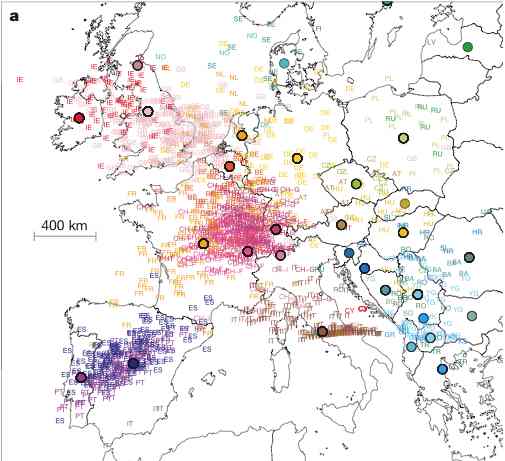 For example, in Novembre
et al., we found that the first two Principal Components (PCs) of
European data closely mirror a map of Europe, and can therefore be
used to infer, with high precision, from where in Europe a particular
individual's DNA originated. The close correspondance between the PCs
and the geographic map is striking, and may seem surprising that an
off-the-shelf method like PCA yields such a elegant result. However,
it turns our that there are good mathematical reasons to expect this
result (i.e., the first two PCs recapitulate geography) provided only
that genetic similarity decays with distance. These reasons involve
fascinating connections between Fourier series and the eigenvectors of
Circulant and Toeplitz
matrices: Novembre and
Stephens describes these connections, and gives references to
other fields where these observations have been made previously.
For example, in Novembre
et al., we found that the first two Principal Components (PCs) of
European data closely mirror a map of Europe, and can therefore be
used to infer, with high precision, from where in Europe a particular
individual's DNA originated. The close correspondance between the PCs
and the geographic map is striking, and may seem surprising that an
off-the-shelf method like PCA yields such a elegant result. However,
it turns our that there are good mathematical reasons to expect this
result (i.e., the first two PCs recapitulate geography) provided only
that genetic similarity decays with distance. These reasons involve
fascinating connections between Fourier series and the eigenvectors of
Circulant and Toeplitz
matrices: Novembre and
Stephens describes these connections, and gives references to
other fields where these observations have been made previously.
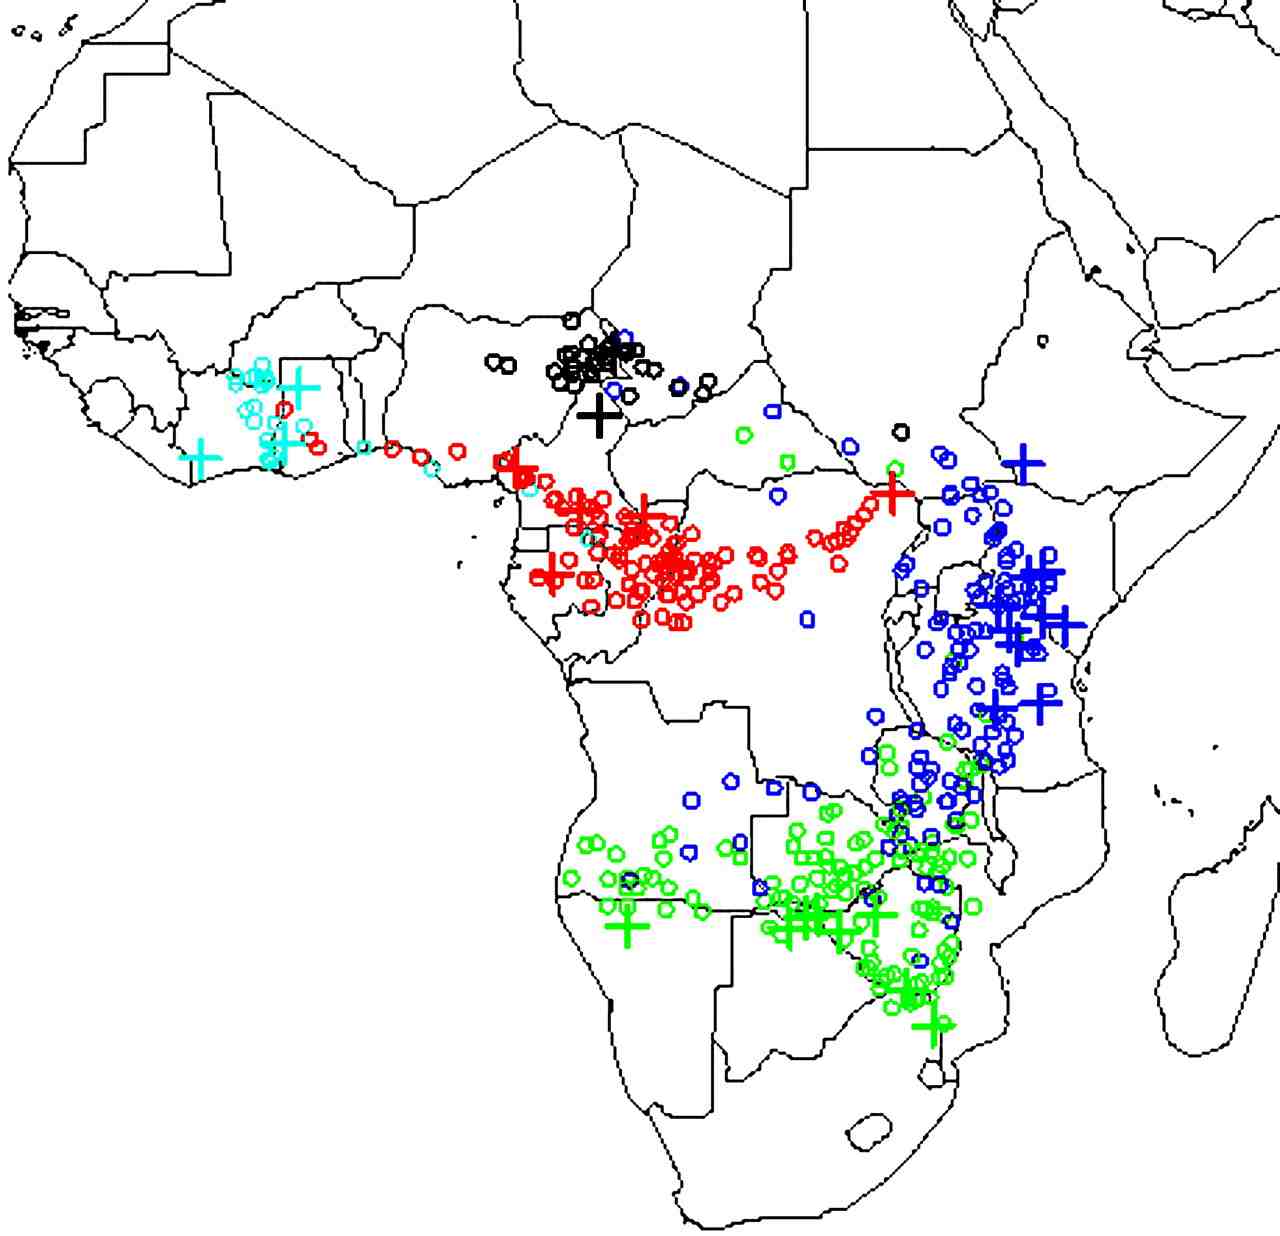 Finally, we have also developed statistical models for continuous
population genetic variation, and applied them to the problem of
determining geographic origin of DNA from elephant tusks (in
collaboration
with Sam
Wasser at the University of
Washington). The motivation here is that if we can identify the
geographic origin of illegally-exported ivory seizures then this will
help law-enforcement authorities identify and control potential
hotspots of illegal elephant poaching. By using reference samples of
DNA from known locations across Africa we have estimated a continuous
"map" of the allele frequencies at each location, using spatial
smoothing methods to estimate frequencies at locations where no
reference samples are available. We can then use this map to identify
the likely origin of samples of unknown origin, by comparing its DNA
with the geographic distribution. We have applied this method to
multiple large seizures of ivory to determine their likely origin
(Wasser et al.). A general
finding among the seizures we have analysed so far is that they appear
to come from rather restricted geographic regions. This suggests that
poaching levels in these locations may greatly exceed previous
estimates, and that urgent action may be required to prevent serious
loss of genetic diversity.
Finally, we have also developed statistical models for continuous
population genetic variation, and applied them to the problem of
determining geographic origin of DNA from elephant tusks (in
collaboration
with Sam
Wasser at the University of
Washington). The motivation here is that if we can identify the
geographic origin of illegally-exported ivory seizures then this will
help law-enforcement authorities identify and control potential
hotspots of illegal elephant poaching. By using reference samples of
DNA from known locations across Africa we have estimated a continuous
"map" of the allele frequencies at each location, using spatial
smoothing methods to estimate frequencies at locations where no
reference samples are available. We can then use this map to identify
the likely origin of samples of unknown origin, by comparing its DNA
with the geographic distribution. We have applied this method to
multiple large seizures of ivory to determine their likely origin
(Wasser et al.). A general
finding among the seizures we have analysed so far is that they appear
to come from rather restricted geographic regions. This suggests that
poaching levels in these locations may greatly exceed previous
estimates, and that urgent action may be required to prevent serious
loss of genetic diversity.
Models for Population Genetic Variation
Much of modern population genetics analysis is based on ideas from
coalescent theory, and its extensions to deal with important
biological phenomena such as recombination and selection. However,
methods of inference based on explicit consideration of coalescent
models turn out to be very computationally intensive, and it is
helpful to consider more computationally-convenient approximations.
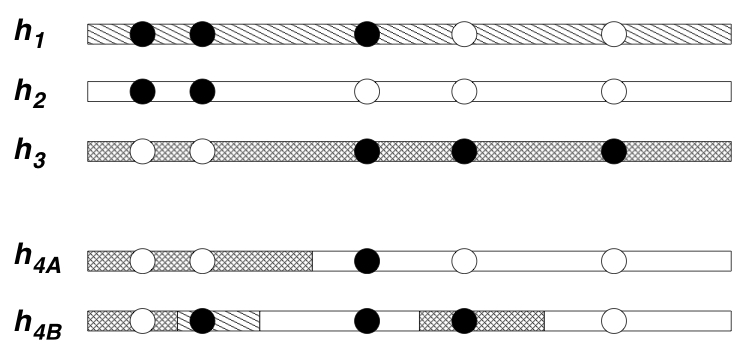 We have developed and used approximations based on Hidden Markov
Models. The idea behind these models is that each haplotype in a
population will closely-resemble a mosaic of "template haplotypes". In
Li and Stephens the templates are
the other haplotypes in a sample; in Scheet and Stephens the templates
are a smaller number of estimated haplotypes, which can be thought of
as a summary of the most frequent combinations in the sample. The
advantage of the latter approach is that by collapsing the templates
into a small number we gain computational advantages; however, this
comes at a cost of a (usually small) decrease in accuracy for some
applications (see Scheet and
Stephens).
We have developed and used approximations based on Hidden Markov
Models. The idea behind these models is that each haplotype in a
population will closely-resemble a mosaic of "template haplotypes". In
Li and Stephens the templates are
the other haplotypes in a sample; in Scheet and Stephens the templates
are a smaller number of estimated haplotypes, which can be thought of
as a summary of the most frequent combinations in the sample. The
advantage of the latter approach is that by collapsing the templates
into a small number we gain computational advantages; however, this
comes at a cost of a (usually small) decrease in accuracy for some
applications (see Scheet and
Stephens).
These models lead to natural ways of visualising genetic variation in a population: simply color each sampled haplotype according to which template it most closely resembles. The idea here is that haplotypes that are similar to one another are colored the same color, and represent relatively recent shared evolutionary ancestry with one another. However, because the extent of shared ancestry between two haplotypes changes as one moves along the genome (due to recombination), the colors change too. The more often the colors change, intuitively the higher the recombination rate. Actually this intuition is not always reliable, but the model of Li and Stephens does turn out to provide very effective ways to estimate the recombination rate between near-by markers from population data. Applications of these methods lead to several novel insights into the recombination process in humans and chimpanzees, including helping to quantify the frequency of recombination hotspots in genes in humans (Crawford et al.) and showing that a recombination hotspot in humans appears to be absent from chimpanzees (Ptak et al.).